

Microsoft Power BI is a business intelligence and data visualization platform that enables users to transform complex data into interactive reports, dashboards, and visualizations. By connecting to a wide variety of data sources, Power BI helps organizations analyze trends, monitor performance, and make informed, data-driven decisions. Its user-friendly interface allows users to explore data through charts, graphs, maps, and other visual tools, making information more accessible and easier to understand.
The SUNY Transfer and Articulation Office utilizes Microsoft Power BI as its preferred data visualization and reporting platform for presenting transfer-related data and analytics. Power BI serves as the foundation for many of the interactive reports and dashboards available through transfer.suny.edu, providing users with a supported, reliable, and dynamic way to access and explore information. Through Power BI, users can filter data, customize views, identify trends, and gain insights that support institutional planning, assessment, and decision-making.
The SUNY web-based transfer reports feature links on the home page each report view to help you navigate. Simply click the title of the report or view you would like to see to navigate to.
Beyond the navigation features built into the dashboard, the Power BI report container provides page navigation controls at the bottom of the report. Users can click the navigation arrows to advance through the report views page by page.
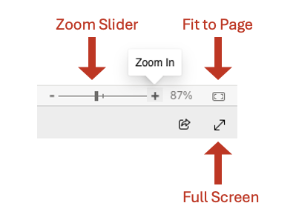
For an enhanced viewing experience, Power BI reports can be expanded to full-screen mode using the report toolbar. This option maximizes the report area and removes surrounding page elements, allowing you to focus on the report content. Users can also adjust the zoom level to increase or decrease the size of report elements. Available zoom options, such as Fit to Page, Fit to Width, and custom zoom percentages, help optimize the display of charts, tables, and other visualizations based on your viewing preferences and screen size.
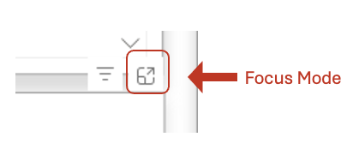
Focus Mode allows you to temporarily isolate and enlarge a single visual within a Power BI report, making it easier to examine the data in greater detail without distractions from other report elements. To access Focus Mode, hover over the desired chart, graph, table, or other visual and select the Focus Mode icon from the visual's toolbar. The selected visual will expand to occupy most of the report window, providing a clearer view of the data, labels, and trends. While in Focus Mode, you can continue to interact with the visual, apply filters, explore data points, and review results more closely. When finished, simply exit Focus Mode to return to the full report and continue your analysis.
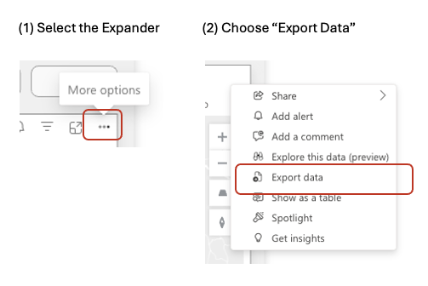
Data export functionality is available only to users who are authenticated through the SUNY Federation. If an authenticated version of a report supports data export, a link to that report will be provided on the report page. When you select the link, you may be prompted to sign in with your SUNY email address if you are not already authenticated. Once signed in, the report will open in the Microsoft Power BI Service (app.powerbi.com) using your institutional credentials. To extract data, hover over the relevant visual or table, and select the menu expander (three dots) to reveal a popup menu with your options.
Access to authenticated reports is managed through Microsoft Power BI. Depending on your campus's security and access policies, you may need to request permission before viewing the report or exporting data. Once access has been granted, available export options can be used to download data from supported report visuals for further analysis.
If you need additional assistance, or have any questions related to the tools provided, do not hesitate to contact our office.